Set Notation, Compound Inequalities, and Systems of Inequalities
After you watch the video and know the material, click HERE for the quiz.
It's good to know that inequalities can help you say things like 'I'm happy when the temperature is above 60 degrees.' But sometimes it's good to be more specific and say something like 'I'm happy when it's between 60 and 90 degrees.' Learn how this relates to a system of inequalities here!
Understanding Inequalities
We've learned that an inequality is just an equation that has a greater than or less than symbol instead of an equals sign, and they help us say things like 'I need at least an 80% to get a B on my history test' or 'The amount of money I spend on video games and plane tickets has to be less than $3,000.' The first example was a 1-variable inequality because the only topic being discussed was the one test score, while the second was a 2-variable inequality because there were video games and plane tickets involved.
Compound Inequalities
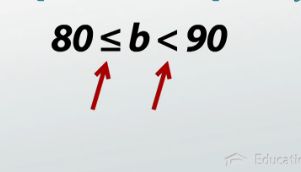
But it's sometimes going to be the case that we want to be more specific than these last two examples. Instead of saying 'I need at least an 80% for a B,' it would actually be more accurate to say 'I need in between an 80% and a 90% to get a B.' When we change 'greater than 80' into 'in between 80 and 90,' we change this 1-variable inequality into a compound inequality because it now has two inequalities in one. It needs to be above 80 and below 90.
As you can see, we can write this compound inequality two different ways - as two separate inequalities (b > 80 and b < 90), or we can combine them both into one (80 < b < 90). When we split it up in to two we use the word and for this example, because in order for it to be a B it has to satisfy both conditions: greater than or equal to 80, less than 90. For example, a 92 is greater than or equal to 80, but it is not less than 90. Therefore, it's not a B.
 |
This also changes our graph from a single dot with an arrow going forever in one direction to two dots with a line segment connecting them. We get this picture by graphing one inequality at a time and then seeing where the two graphs overlap. We can start with doing b > 80. I put a filled-in circle at 80 (because it's or equal to) and I draw my arrow going to the right to indicate that it could be any number bigger than 80. Next, we put an open circle at 90 (because it's just less than) and we draw an arrow going to the left to indicate that it can be any number smaller than 90. But we then have to remember that the solution is the space where they are both true. This means the only part of the graph we want is where they overlap, and what we end up with is a line connecting our two points. All compound inequalities that are sandwiched in between two values are called 'and' compound inequalities and have graphs that look something like this.
But we can also have what are called 'or' compound inequalities. For example, if instead we were describing the different ways I could get something other than a B, we would want to say that I could get less than an 80 or greater than or equal to 90. Now, instead of having to satisfy both conditions like before, it can satisfy either and still be okay. Getting less than 80 is one way to not get a B, but getting 90 or above is another way. They both work.
For example, a 72% is less than 80, so it's not a B. It doesn't matter that it isn't also greater than 90. It only has to satisfy one of the conditions. This means that our graph is a little bit different as well. It will again be two arrows, but this time we won't need them to overlap. We can put one circle at 80 and draw our arrow covering all the values smaller than it, and then put another circle (this time filled in because it's or equal to) at 90 and draw our arrow going up (because we want all the values that are bigger). Again, we're not worried about where these graphs overlap because satisfying either one of these conditions is enough; they don't have to satisfy both to not be a B. All compound inequalities where you only need to satisfy one of the requirements are called 'or' compound inequalities and will have graphs that look something like this.
Set Notation
 |
As a quick note, some mathematicians like to use what is called set notation to express solutions to 1-variable inequalities. It can be a little bit nicer to read but does require you to know some new symbols. Our first answer, 80 < b < 90, could be expressed using set notation like this: (bracket)80,90). The first number is the lower bound and the second is the upper bound. The bracket in the front indicates or equal to, while the parenthesis on the end indicates just less than. Using the same type of logic says that our second answer, b < 80 OR b > 90, could be written like this: (bracket)0, 80) u (bracket)90,100(bracket). The u symbol in the middle stands for union and means that both sets are correct answers, while the first group says that anything from 0 to 79.9 repeating is not a B, and the last tells us that anything between 90 and 100 is also not a B. If there was no limit to how bad or good you could do on a test, we could use negative infinity and positive infinity to represent the fact that the solution could be as big or as small as we wanted it to be.
System of Inequalities
Just like we can have multiple 1-variable inequalities in a single problem, we can have multiple 2-variable inequalities in a single problem as well. When this happens, it's called a system of inequalities. While I suppose it would be possible to have an 'or' system of inequalities, I can't remember seeing an example of this in all my years of teaching. This means that when we graph a system of inequalities, we can assume it is an 'and' problem, which means our answer is only the parts of the graph that overlap.
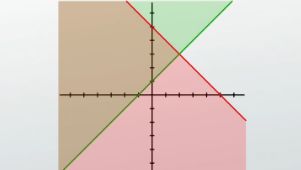 |
Just like the 'and' compound inequality problem, we can graph a system of inequalities by doing one inequality at a time and then erasing the parts where only one is true but not the other. For example, if you were asked to graph y > x + 1 and y < -x + 5, we could begin by simply putting the graph of y > x + 1 on our axis, getting this. We could then put our graph of y < -x + 5 directly on top of it to get this. If we theoretically had an 'or' system of inequalities, our solution would simply be any point that has any shading at all on it. But given that all the examples I've seen are 'and' examples, our answer is only the areas on the graph where the shading overlaps, leaving our answer as the purple area in this graph.
Systems of inequalities can have as many inequalities as we would like. It would be really easy to add a third inequality to this problem, say y > -2x -5. In order to graph this, we would simply take our previous graph and lay another inequality right on top of it. The graph of y > -2x -5 would look like this, and now our solution becomes the only places on the graph where all three shaded areas intersect. It looks like what we end up with is a small, triangular piece of area that's more or less in the second quadrant of our graph.
Lesson Summary
To review:
- Compound inequalities are problems with multiple 1-variable inequalities in them.
- Systems of inequalities are problems with multiple 2-variable inequalities in them.
- If an answer must satisfy all the conditions, it is an 'and' inequality, but if satisfying one of the conditions is enough to be a solution, then it is an 'or' inequality.