
File:LinearRegression.svg
- File
- File usage
- Metadata
- Did you know...?
| |
This is a file from the Wikimedia Commons. Information from its description page there is shown below.
Commons is a freely licensed media file repository. You can help. |
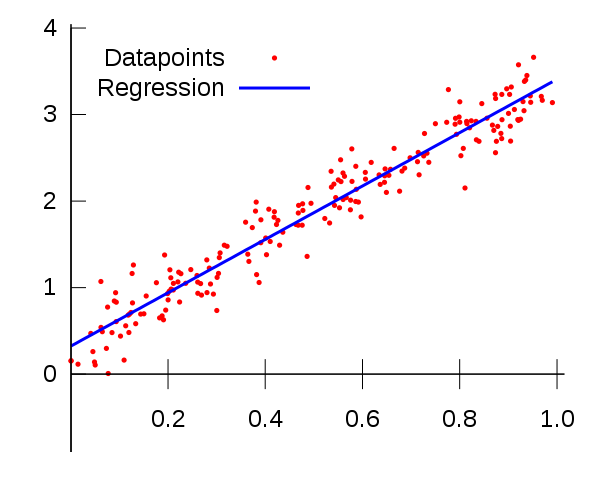
| Description | Illustration of linear regression on a data set. |
| Date | 24 June 2007 |
| Source | self-made in Gnuplot. |
| Author | Berland |
Gnuplot source code
set terminal svg fname "Helvetica" fsize 25
set output "LinearRegression.svg"
set key left
set xtics axis 4.0,0.5
set ytics nomirror 1
set border 2
f(x) = a*x + b
fit f(x) 'randpts' using 1:2 via a,b
set yrange [-0.9:4]
plot 'randpts' with points pointtype 7 pointsize 0.3 title 'Datapoints', \
        f(x) with lines linetype 3 linewidth 3 title 'Regression',  \
        0 with lines linetype -1 notitle
The datafile 'randpts' was made in GNU Octave using the commands
f = fopen('randpts', 'w');
for i=1:200;
   x=rand(1);
   y=0.2*randn(1) + 3*x + 0.35;
   fprintf(f, '%g %g\n', x, y);
end
fclose(f)
(identical code also works in Matlab.)
Licensing
 |
This work has been released into the public domain by its author, I, Berland. This applies worldwide. In some countries this may not be legally possible; if so: I, Berland grants anyone the right to use this work for any purpose, without any conditions, unless such conditions are required by law.
|
Metadata
Did you know...?
Through Schools Wikipedia, SOS Children's Villages has brought learning to children around the world. In 133 nations around the world, SOS Childrens Villages works to bring better education and healthcare to families in desperate need of support. Would you like to sponsor a child?