
File:Standard deviation.svg
- File
- File usage
- Metadata
- Did you know...?
| |
This is a file from the Wikimedia Commons. Information from its description page there is shown below.
Commons is a freely licensed media file repository. You can help. |
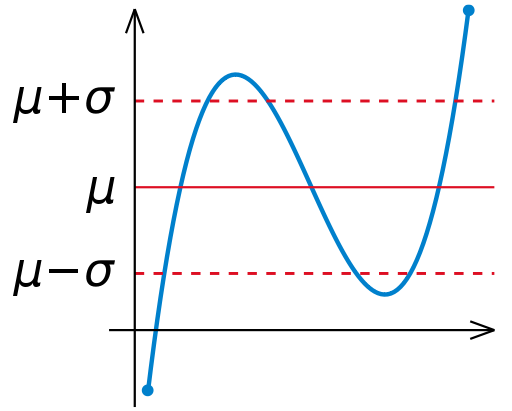
| Description | Illustration of en:Standard deviation |
| Date | 04:55, 4 August 2007 (UTC) |
| Source | self-made with MATLAB. Tweaked in Inkscape |
| Author | Oleg Alexandrov 04:55, 4 August 2007 (UTC) |
| Permission ( Reusing this file) |
PD-self |
 |
I, the copyright holder of this work, release this work into the public domain. This applies worldwide. In some countries this may not be legally possible; if so: I grant anyone the right to use this work for any purpose, without any conditions, unless such conditions are required by law.
|
Source code ( MATLAB)
% Illustartion of standard deviation
function main()
   a=-1.2; b = 1.3;
   c = -0.5; d = 2.5;
   N=100;

   X=linspace(a, b, N);
   Y=X.^3-0.2*X.^2-X+2;
%   Y=X.^2;

   % scale Y to fit in the plotting window
   Y = (Y-min(Y))/(max(Y)-min(Y));
   Y = Y*(d-c)+c;

   mean = sum(Y)/length(Y);
   stdev = sqrt(sum((Y-mean).*(Y-mean))/length(Y));

   figure(1); clf; hold on; axis off; axis equal;

   lw = 3; % linewidth
   lw2 = lw/2;
   lw3 = lw/1.5;
   fs = 30; % font size
   red=[0.867 0.06 0.14];
   blue = [0, 129, 205]/256;
   green = [0, 200,  70]/256;
   black = [0, 0, 0];

   % plot the curves
   shiftl=a-0.1;
   small=0.2;
   plot(X, Y, 'linewidth', lw, 'colour', blue);
   plot([shiftl max(X)+small], [mean, mean], 'linewidth', lw2, 'colour', red);
   plot([shiftl max(X)+small], [mean, mean]+stdev, 'linewidth', lw3, 'colour', red, 'linestyle', '--');
   plot([shiftl max(X)+small], [mean, mean]-stdev, 'linewidth', lw3, 'colour', red, 'linestyle', '--');

% plot some balls for beauty
   n = length(X);
   ball_rad = 0.03;
   ball(X(1), Y(1), ball_rad, blue)
   ball(X(n), Y(n), ball_rad, blue)

% axes
   small=0.2;
   arrowsize=0.2; arrow_type=0;
   angle=20; % in degrees

   arrow([shiftl-0.2 0], [b+0.2, 0],             lw2, arrowsize, angle, arrow_type, black)
   arrow([shiftl, min(Y-0.1)], [shiftl, max(Y)], lw2, arrowsize, angle, arrow_type, black)

% text
   small1 = 0.3; small2 = 0.3;
   text(shiftl-small1, mean,  '\mu', 'fontsize', fs)
   text(shiftl-small1-small2, mean+stdev,  '\mu+\sigma', 'fontsize', fs)
   text(shiftl-small1-small2, mean-stdev,  '\mu-\sigma', 'fontsize', fs)
%   H=text(0.1, -0.1,  'x_{n+1}'); set(H, 'fontsize', fs)
%   H=text(0.7, -0.1,  'x_{n}'); set(H, 'fontsize', fs)

% save to disk
   saveas(gcf, 'Standard_deviation.eps', 'psc2')
%   plot2svg('Standard_deviation.svg');

function arrow(start, stop, thickness, arrow_size, sharpness, arrow_type, colour)

% Function arguments:
% start, stop:  start and end coordinates of arrow, vectors of size 2
% thickness:    thickness of arrow stick
% arrow_size:   the size of the two sides of the angle in this picture ->
% sharpness:    angle between the arrow stick and arrow side, in degrees
% arrow_type:   1 for filled arrow, otherwise the arrow will be just two segments
% color:        arrow colour, a vector of length three with values in [0, 1]

% convert to complex numbers
   i=sqrt(-1);
   start=start(1)+i*start(2); stop=stop(1)+i*stop(2);
   rotate_angle=exp(i*pi*sharpness/180);

% points making up the arrow tip (besides the "stop" point)
   point1 = stop - (arrow_size*rotate_angle)*(stop-start)/abs(stop-start);
   point2 = stop - (arrow_size/rotate_angle)*(stop-start)/abs(stop-start);

   if arrow_type==1 % filled arrow

% plot the stick, but not till the end, looks bad
      t=0.5*arrow_size*cos(pi*sharpness/180)/abs(stop-start); stop1=t*start+(1-t)*stop;
      plot(real([start, stop1]), imag([start, stop1]), 'LineWidth', thickness, 'Colour', colour);

% fill the arrow
      H=fill(real([stop, point1, point2]), imag([stop, point1, point2]), colour);
      set(H, 'EdgeColor', 'none')

   else % two-segment arrow
      plot(real([start, stop]), imag([start, stop]),   'LineWidth', thickness, 'Colour', colour);
      plot(real([stop, point1]), imag([stop, point1]), 'LineWidth', thickness, 'Colour', colour);
      plot(real([stop, point2]), imag([stop, point2]), 'LineWidth', thickness, 'Colour', colour);
   end


function ball(x, y, r, colour)
   Theta=0:0.1:2*pi;
   X=r*cos(Theta)+x;
   Y=r*sin(Theta)+y;
   H=fill(X, Y, colour);
   set(H, 'EdgeColor', 'none');
Metadata
Did you know...?
Schools Wikipedia was created by children's charity SOS Childrens Villages. SOS Children's Villages cares for children who have lost their parents. Our Children's Villages give these children a new home and a new family, while a high-quality education and the best of medical care ensures they will grow up with all they need to succeed in adult life. We have helped children in Africa for many years - you can help too...