
File:Complex numbers addition.png
- File
- File usage
- A background to Schools Wikipedia

| |
This is a file from the Wikimedia Commons. Information from its description page there is shown below.
Commons is a freely licensed media file repository. You can help. |
La bildo estas kopiita de wikipedia:en. La originala priskribo estas:
Contents |
Summary
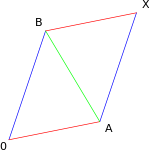
Made by myself with matlab.
 |
File:Complex numbers addition.svg is a vector version of this file. It should be used in place of this raster image when superior. File:Complex numbers addition.png
For more information about vector graphics, read about Commons transition to SVG.
|
 |
Licensing
 |
This work has been released into the public domain by its author, Oleg Alexandrov at the English Wikipedia project. This applies worldwide. In case this is not legally possible: |
Source code
function main ()

% set up the plotting window
thickness=2.5; fs=30; d=0.004;
red=[1, 0, 0]; green=[0, 1, 0]; blue=[0, 0, 1];
figure(1); clf; hold on; axis equal; axis off;
i=sqrt(-1);

z1=0; z2=1+0.2*i; z3=0.4+1.2*i;
plot_seg(z1, z2, red, thickness);
plot_seg(z2, z3, green, thickness);
plot_seg(z3, z1, blue, thickness);

pt (z1, fs, 5, d, '0');
pt (z2, fs, 7, d, 'A');
pt (z3, fs, 3, d, 'B');
pt (z2+z3, fs, 1, d, 'X');

t=z2;
z1=z2+z3; z2=z3; z3=t;
plot_seg(z1, z2, red, thickness);
plot_seg(z2, z3, green, thickness);
plot_seg(z3, z1, blue, thickness);

saveas(gcf, 'Complex_numbers_addition.eps', 'psc2')
% convert from eps to png with shell command
% convert -antialias -density 400 -scale 20% Complex_numbers_addition.eps Complex_numbers_addition.png

function plot_seg(z1, z2, color, thickness);
  plot( [real(z1), real(z2)], [imag(z1), imag(z2)], 'color', colour, 'linewidth', thickness );

function pt (z, fs, pos, d, tx)
 p=cos(pi/4)+sqrt(-1)*sin(pi/4);
 z = z + p^pos * d * fs;
 shiftx=0.0003;
 shifty=0.002;
 x = real (z); y=imag(z);
 H=text(x+shiftx*fs, y+shifty*fs, tx); set(H, 'fontsize', fs, 'HorizontalAlignment', 'c', 'VerticalAlignment', 'c')
| date/time | username | edit summary |
|---|---|---|
| 04:43, 24 October 2005 | en:User:Oleg Alexandrov | (source code) |
| 03:44, 24 October 2005 | en:User:Oleg Alexandrov | (Made by myself with matlab.) |
|
|
This chart was created with MATLAB. |
Historio de la dosiero
Legend: (cur) = this is the current file, (del) = delete this old version, (rev) = revert to this old version.
Click on date to download the file or see the image uploaded on that date.
- (del) (cur) 04:36, 24 October 2005 . . en:User:Oleg_Alexandrov Oleg Alexandrov ( en:User_talk:Oleg_Alexandrov Talk) . . 468x473 (16254 bytes) (Made by myself with matlab. )
- (del) (rev) 04:34, 24 October 2005 . . en:User:Oleg_Alexandrov Oleg Alexandrov ( en:User_talk:Oleg_Alexandrov Talk) . . 234x237 (6597 bytes) (Made by myself with matlab. )
- (del) (rev) 04:28, 24 October 2005 . . en:User:Oleg_Alexandrov Oleg Alexandrov ( en:User_talk:Oleg_Alexandrov Talk) . . 168x236 (6146 bytes) (Made by myself with matlab. )
- (del) (rev) 04:26, 24 October 2005 . . en:User:Oleg_Alexandrov Oleg Alexandrov ( en:User_talk:Oleg_Alexandrov Talk) . . 130x236 (4374 bytes) (Made by myself with matlab. )
- (del) (rev) 03:44, 24 October 2005 . . en:User:Oleg_Alexandrov Oleg Alexandrov ( en:User_talk:Oleg_Alexandrov Talk) . . 244x148 (4471 bytes) (Made by myself with matlab. )
A background to Schools Wikipedia
Learning is fun and easy with Schools Wikipedia. SOS Children's Villages works in 133 countries and territories across the globe, helps more than 62,000 children, and reaches over 2 million people in total. There are many ways to help with SOS Childrens Villages.